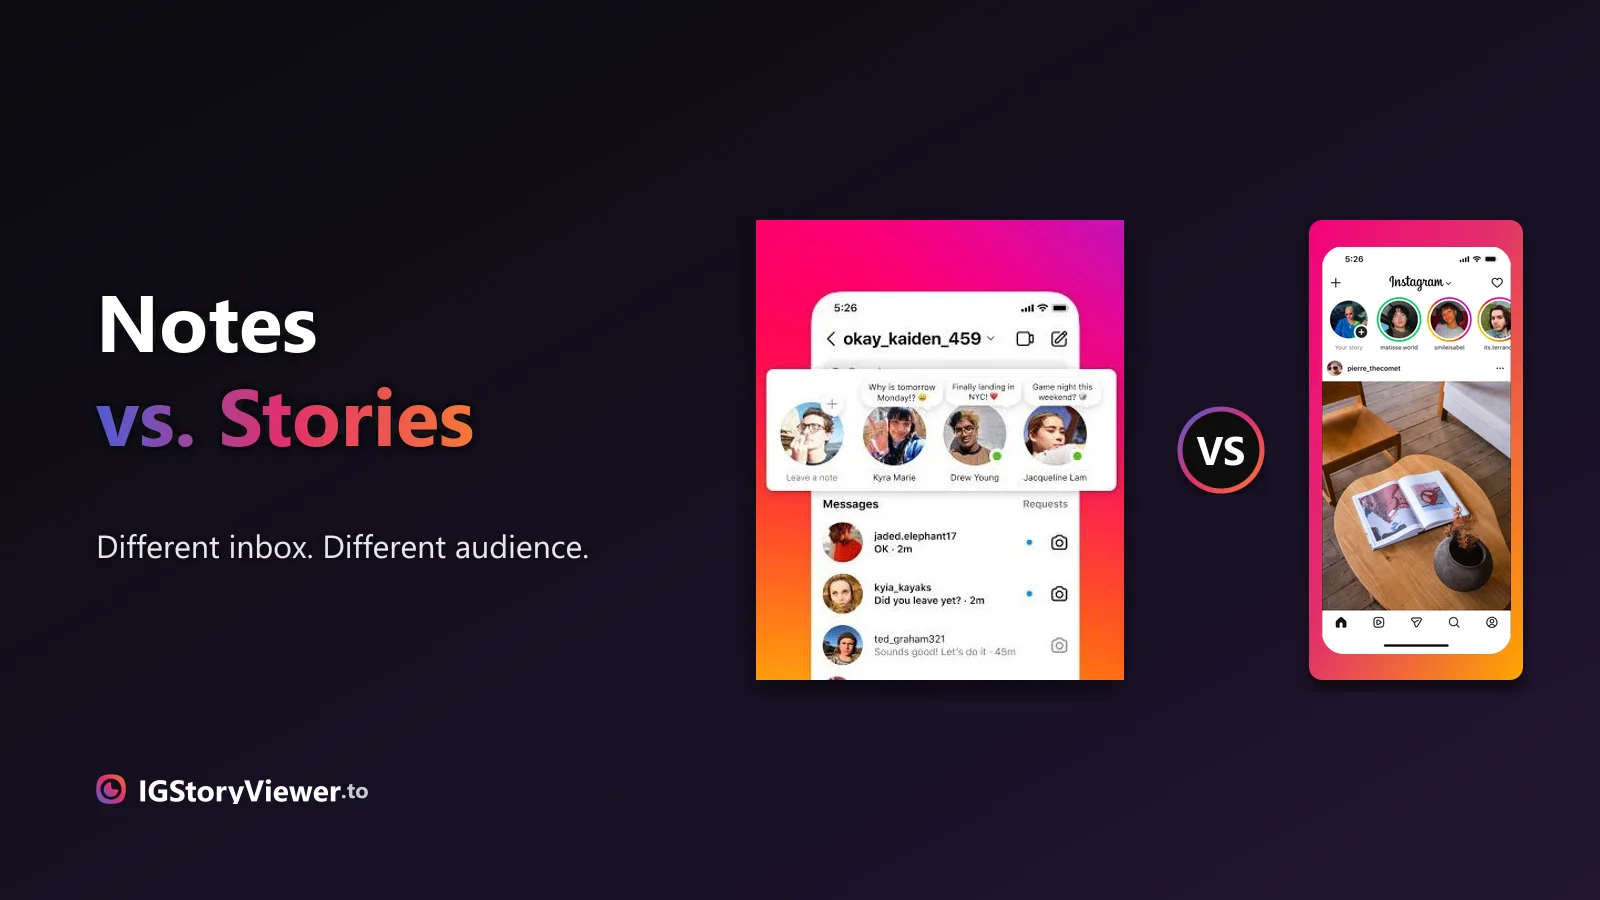
Instagram Notes vs. Stories: What's the Difference and Who Actually Sees It
A Note lives above your DM inbox and disappears in a day. A Story lives in the main feed. Here's what actually separates them.
 IG Story Viewer TeamSeptember 22, 20266 min read
Your Insights tab shows seven numbers and no explanation. Here's what each one actually measures, and which ones genuinely aren't worth obsessing over.
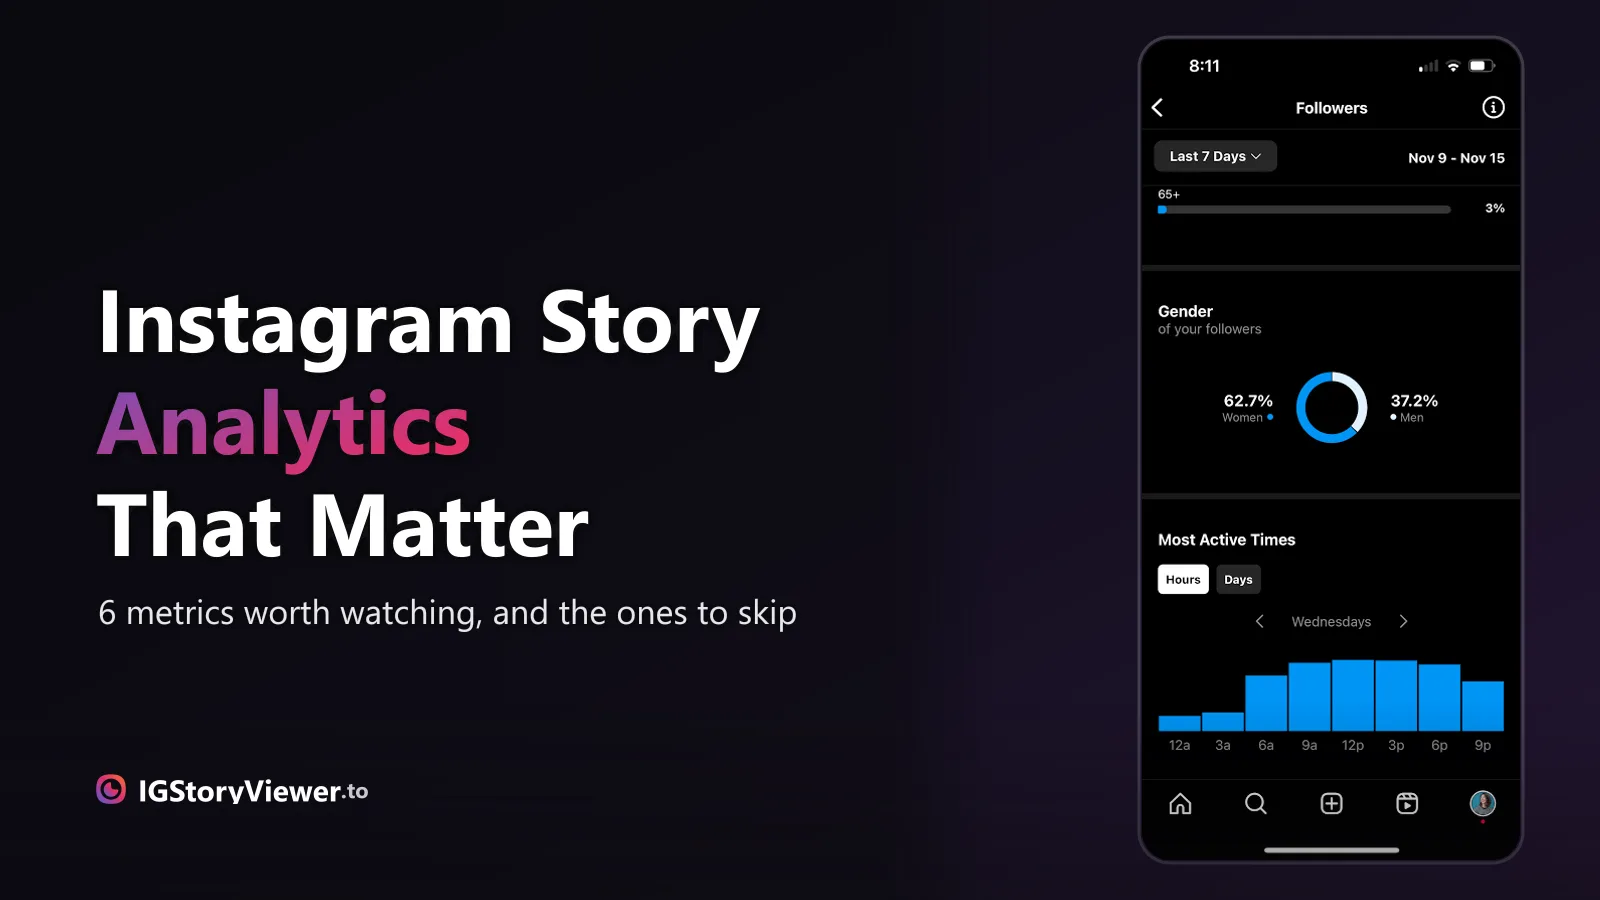
You open the Insights tab under one of your stories and get seven numbers with no explanation: reach, impressions, taps forward, taps back, exits, replies, sometimes a sticker tap count. Most of them look important. Not all of them actually are.
Here's what each one really measures, and which ones you can stop checking every time.
Reach is how many unique accounts saw at least one frame of your story. Impressions is the total number of times it was viewed, including repeats — so impressions is always equal to or higher than reach. The gap between the two tells you something reach alone can't: a story with impressions well above its reach means a meaningful number of people watched it more than once, tapped back to rewatch a frame, or saw it show up again in a highlight.
Almost every other number on the list is really a percentage of one of these two — which is why reach and impressions are worth glancing at first, before anything else on the screen.
| Reach | Unique accounts that saw the story | Trending up compared to your own recent stories |
| Impressions | Total views, including repeats | Noticeably higher than reach — people are rewatching |
| Taps forward | Viewer tapped to skip to the next frame | Low relative to reach — high usually means that frame lost interest fast |
| Taps back | Viewer tapped to rewatch the previous frame | Any meaningful count — this is a deliberate "show me that again" |
| Exits | Viewer left the story entirely (closed it or swiped away) | Spread evenly, not spiking on one specific frame |
| Replies | Direct messages sent in response | Any at all — a reply is the strongest engagement signal Stories have |
Taps forward and exits both look like bad news, but they mean different things. A tap forward means the viewer is still in your story — they just wanted to move past one specific frame faster. A spike of taps forward on frame 3 of 5 usually means frame 3 specifically wasn't holding attention, not that the whole story failed.
An exit is a harder signal — the viewer left the story format altogether, closing the app or swiping down instead of just moving to the next frame. If exits cluster heavily on one frame, that's the frame that actually lost the viewer, not just slowed them down. If exits are spread evenly across every frame, it's more likely just normal attrition than any one frame doing something wrong.
Replies are the one metric worth paying the most attention to, because they can't happen by accident. A tap forward takes no intent; a reply means someone stopped, typed something, and sent it — that's a much stronger signal than a view ever is.
A rewatch someone chose to do. Rare in absolute terms, but meaningful whenever it happens.
If one frame in the sequence loses far more viewers than the rest, that's the frame to look at first.
The strongest engagement signal a Story has — it requires a viewer to stop and type something.
A widening gap over time usually means people are rewatching, not just seeing it once and moving on.
Checking Insights obsessively in the first hour doesn't tell you much — reach and impressions are still climbing as more of your followers open the app throughout the day. A more useful read comes 12 to 24 hours in, once the story's mostly finished circulating and the numbers have settled.
If you post multiple stories a day, it's more useful to look at them as a set once a week than to judge each one in isolation. A single story with a quiet reply count doesn't mean much on its own — the same pattern across ten stories in a row actually does.
Sticker taps (poll votes, quiz answers, the slider) are fun to watch climb in real time, but they're a novelty metric, not a performance one — a poll gets tapped because it's easy, not because the story around it worked. Don't read too much into a single story's sticker count.
The same goes for checking whether your follower count moved after one specific story. It almost never will, in either direction, and trying to attribute a handful of follows or unfollows to one 24-hour post is chasing noise, not a signal.
And you can't compare your numbers to another account's at all — Instagram Insights are private to the account owner. If you want to see what's actually live on a public account right now, without any of this, our story viewer shows their current story directly, at full quality.
These six numbers only tell the story half the story — the other half is which format you used in the first place. Story, post, and Reel each optimize for a different outcome, so a Story with modest reach isn't necessarily underperforming; it might just be doing the depth-over-reach job it was always going to do.
If the numbers tell you a particular kind of story consistently earns replies or rewatches, that's worth remembering next time you're short on what to post — 37 Story ideas is a reasonable place to start if you want to test a new format against what's already working.
Open any public account's current Story in your browser, at its original quality — no login, no app required.
We build a free, anonymous Instagram story viewer and write practical guides on watching, saving, and understanding Instagram stories — without the hype.
More about usA Note lives above your DM inbox and disappears in a day. A Story lives in the main feed. Here's what actually separates them.

The row of circles under your bio is simpler to build than it looks — here's how to create one, design a cover that matches, and edit it without losing anything.